2025
In this post, I explore how multi-threading can improve the latency of LLM Judges. I introduce the concept of "orthogonality" as a key heuristic for determining when LLM Judge evaluation tasks can be parallelized without sacrificing quality. Then, I run a controlled experiment using MT Bench data to demonstrate the latency benefits of multi-threading, finding that the multi-threaded approach reduced latency by 38% compared to the single-threaded approach. The code used to run this experiment is also provided.
RAG-Powered LLM Longevity Coach
A simple RAG-powered 'Longevity Coach' that uses a vector store and an LLM to deliver targeted health insights informed by user-provided health data (including genetics, lab results, supplements/medications taken, etc.). By using RAG, the app reduces token usage and ensures only the most relevant data is used to respond to user queries.
Analysis of the GenAI/LLM job market in January 2025
A data-driven exploration of the GenAI/LLM job market for science and engineering roles in January 2025. I scrape ~1000 job postings from ai-jobs.net, perform data extraction and classification using LLMs, and then analyze the data to identify patterns and insights about the GenAI/LLM job market, including salary ranges, skill requirements, and role distribution.
In this post, I re-evaluate a method that was recently published in arXiv, critiquing their baseline model and then designing a new baseline model that implements standard best practices for comparison with the new method. I find that the new evaluation method proposed in the paper does not perform better than this robust baseline. This serves to highlight the importance of implementing best practices in baseline models for comparison with new methods, as well as being skeptical of claims in research papers that compare new methods to baseline.
2023
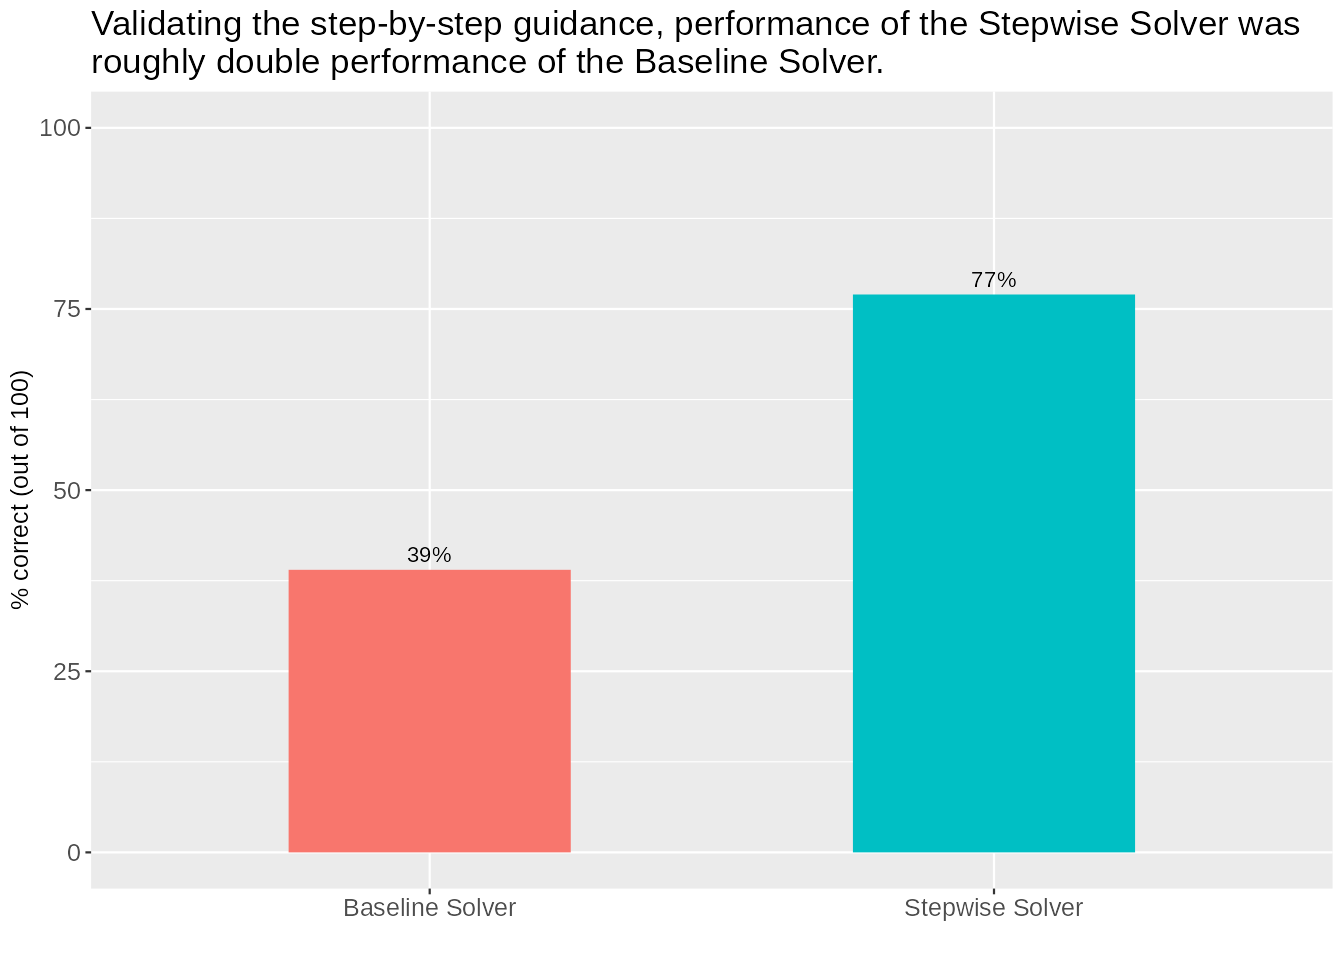
AI Math Tutoring: Using GPT to generate "step-by-step guidance"
In this post, I show how an AI Tutor feature like "step-by-step guidance" can be built to help students on multi-step math problems, and how this guidance can be validated.

Tackling the GSM8K (grade school math) with GPT-3.5 and self-consistency prompting
In this post, I use the "Self-Consistency" prompt engineering strategy to improve the performance of a GPT-3.5 based model tasked with solving problems from the GSM8K (grade school math) dataset. I explore two implementations of this strategy, finding that one is more effective than the other. Overall, I find that this strategy is effective, leading to an increase in the percentage of correct answers from 75% at baseline to 93% with the strongest implementation of the strategy.

Using GPT-4 for classification
In this post, I use GPT-4 to classify US grant-funding agencies into 10 categories using government agency names. Then I summarize funding by category.

Encoding high cardinality features with "embeddings"
In this post I show how the performance of an ML model can be improved by encoding high cardinality features using "embeddings", a method that uses deep learning to represent categorical features as vectors. I compare the performance of embedding encoding with other common categorical encoding methods: one-hot, label, frequency, and target encoding.

Using random forest based outlier detection to clean a training dataset
In this post, I explore whether a random forest model can be improved by using random forest based multivariate outlier detection and imputation methods, and by reducing feature multicollinearity. Supporting the common wisdom that random forest models are robust to outliers and multicollinearity, these data cleaning steps led to only marginal improvements in out-of-sample model performance.

Joining messy dataframes using fuzzy joining, string cleaning, and column binding
Tidy Tuesday this week presented a challenge: "There are two datasets this week for which the rows align, but the values might not precisely line up for a clean join." In this post I walkthrough my solution that uses a combination of fuzzy joining, string cleaning, and column binding.

I use data normalization to better compare the changes in refugee outflows in different regions from 2010 to 2022. Four regions are identified with large increases over their 2010 baseline.

Building a prediction model to detect spam email
Using the spam email dataset from Tidy Tuesday Week 33, I walk through the process of building and evaluating a prediction model using decision tree and random forest machine learning algorithms.

2020
Modeling cognitive impairment using NHANES data
I build a machine learning model to predict possible cases of cognitive impairment / dementia in a population of individuals over the age of 60. My data for this model comes from the 2013-2014 NHANES (National Health and Nutrition Examination Survey) study cohort, which is a nationally representative, longitudinal study of health in the US.

Estimating how many people live near a landmark / point-of-interest
In this post, I start with a point-of-interest, "Times Square, NYC", and using the Census API I find out how many people live within the census tract that contains this POI (a tract is one of the smallest sub-divisions for which the Census provides population estimates).

Identifying pneumonia from chest x-rays using EfficientNet
I was interested in trying tensorflow + EfficientNet on another image classification task. This time, I used it to predict pneumonia on chest x-ray images. Using this model, I achieved 97% out of sample accuracy.

Using tensorflow with EfficientNet to predict plant diseases
I use tensorflow with an EfficientNet base model (via transfer learning) to predict plant diseases for the Plant Pathology 2020 Kaggle challenge. Using this model, I achieved 94% out of sample accuracy.

COVID-19 case growth and the Big 5 Personality traits
Does the growth in COVID-19 cases have anything to do with Big 5 Personality traits? To answer this question, I compute country-level aggregates on the Big 5 test, and a country-level aggregate that represents for "growth" over time in coronavirus cases, using data current as of March 20, 2020.

Using a logistic regression model to predict heart disease
I trained a logistic regression model to predict heart disease, using 14 attributes and 303 observations (e.g., age, sex, chest pain, resting ECG). Then I evaluated its performance.

2019
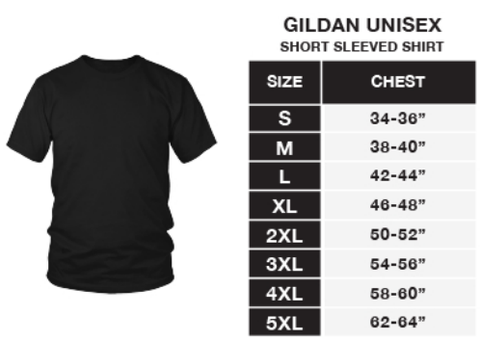
Predicting t-shirt size from height and weight
Using body measurement data from the National Health and Nutrition Examination Survey (NHANES), I created a model that predicts Gildan t-shirt sizes from height and weight.
